Investment Sharing 1

Never depend on single income. Make investment to create a second source.-Warren Buffet

Investment Sharing 2

An investment in knowledge pays the best interest.-Benjamin Franklin

Investment Sharing 3

Anyone who is not investing now is missing a tremendous opportunity.-Carlos Sim

Investment Sharing 4

In short run, the market is a voting machine, but in long run it is a weighing machine.-Benjamin Graham

Investment Sharing 5

Dont look for needle in the haystack. Just buy the haystack.-Jack Bogle

Sunday, 26 October 2014

Dollar Still Firm

The US dollar gained against most of the major foreign currencies last week, but the overall tone, leaving aside the yen, was largely consolidative in nature. The greenback was soft in the first half of the week but recovered in the second half.
The Australian and Canadian dollars were the only major currencies that managed to hold onto some of their gains (0.55% and 0.40% respectively). The yen was the weakest of the majors, losing 1.2%, as the panic from the week before died down. Equity markets were mostly higher, with the Nikkei's 5.2% rise, leading the major markets. US 10-year Treasury yields rose 8 bp. Core bonds generally traded heavier, but European peripheral bonds were firmer, in line with the calmer conditions.
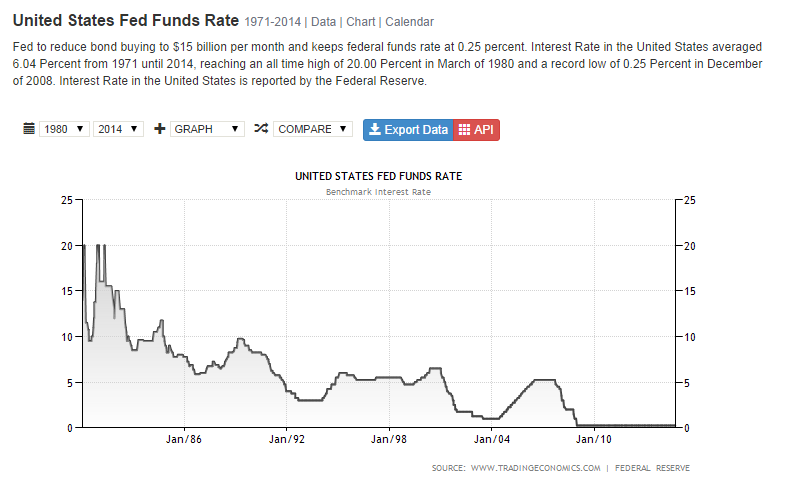
We were never persuaded that last week's turmoil would prevent the Fed from completing its tapering operation, and see that in the market, cooler heads are prevailing. Talk of "tapering the tapering" has diminished, and no one is taking too seriously the prospects of QE4. Nevertheless, we note that both the December 2015 Fed funds and eurodollar futures contracts were unchanged on the week at 46 bp and 77 bp respectively.
Perhaps offsetting the diminished interest rate support for the dollar has been speculation that more action from the European Central Bank and the Bank of Japan could be imminent. Reports suggested that the ECB may consider adding corporate bonds to its asset purchase program. There were also report suggesting that the BOJ sees risk that inflation may fall, and this could prompt an extension of the already aggressive Qualitative and Quantitative Easing. We are skeptical that either will materialize in the coming weeks. The BOJ meets next week and the ECB the following week.
Technically, the euro looks poised to continue to consolidate. Most of last week's price action took place within the $1.2625-$1.2886 range set on October 15. In recent session, the euro flirted with the lower end and slipped to about $1.2615. The euro spent the second half of the week below the 20-day moving average, which comes in near $1.2690. This is the nearby cap. Of note, the nearly four-cent bounce in the euro has not been accompanied by a sharp change in euro positioning The confidence of the euro bears is palpable and quite widespread.
The bearishness toward the yen was more evident in the price action than in the euro. We had identified the yen's gains as among the most exaggerated in last week's technical note. The dollar's recovery last week recouped 61.8% of its slide from the push marginally above JPY110 on October 1. It closed above its 20-day moving average in the two sessions before the weekend for the first time since early this month. The RSI has been recovering, and the MACDs have now crossed higher. The risk is that the speculation of more action by the BOJ is getting ahead of itself. This may help cap the dollar, where a trendline drawn off the early October highs comes in around JPY108.70-80 next week.
From a technical perspective, sterling continues to look constructive.Bullish divergence continues to be evident in the daily RSI and MACD. It could be important that the $1.60 area largely held in the second half of last week. It appears that sterling may be carving out a head and shoulder near $0.8650. Before the weekend, the aussie tested both sides of the pattern. It closed firm, in an outside day, though off its high and just below the previous day's high. This is still impressive because of increased speculation that the central bank is considering cutting interest rates. This chart pattern is notorious for false breaks, and the technical indicators do not appear to be generating strong signals.
The US dollar pulled back against the Canadian dollar to challenge the past month's uptrend. It is found near the 20-day moving average, just above CAD1.1210. The US dollar could not get back above CAD1.13 in the first half of the week and came down to test CAD1.1180-CAD1.1200 in the second half of the week. It has been unable to close below the 20-day average for a month. The MACDs are turning lower, though the RSI is in neutral.
The US dollar has also been riding the 20-day moving average higher against the Mexican peso. It comes in now near MXN13.48. The greenback has lost some momentum in recent day but has not pulled back from the highs very much. There is no compelling technical evidence to conclude a dollar top is in place.

Thursday, 16 October 2014

What is Capitulation?

What is capitulation? CNBC Explains

Traditionally, the word capitulation describes a surrender between fighting armies. What is capitulation when it's used on Wall Street? What does it signify? We explain.

What is capitulation?

In simple terms, capitulation is when investors try to get out of the stock market as quickly as possibleand look for less risky investments. It's also described as panic selling. It's usually based on investor fears that stock prices will fall further than they have.

Capitulation is usually signaled by a decline in the markets of at least 10% in one day.

In getting out of the market, investors give up any previous gains in stock price. That means they take a financial loss, just to get out of stocks. The thinking is: take a smaller loss now rather than a bigger one later.

Real capitulation involves extremely high volume-or high numbers of traded shares-and sharp declines in stock prices.

Why do investors capitulate?

Suppose a stock starts dropping in price. There are two choices. Investors stick it out and hope the stock begins to appreciate-or they can take the loss by selling the stock.

If the majority of investors decide to wait it out, then the stock price will probably remain stable. But if the majority of investors decide to capitulate and give up on a stock, they start selling and that starts a sharp decline in a stock's price.

Are there any benefits from capitulation?

Only for those buyers ready to swoop in. After capitulation selling, common wisdom has it that there are great bargains to be had in the stock market. Why? Because everyone who wants to get out of a stock, for any reason, has sold it. The price should then, theoretically, reverse or bounce off the lowest price of the stock.

In other words, some investors believe that capitulation is the sign of a bottom and a chance to get stocks at a cheaper price than before the capitulation took place.

Is capitulation a way to gauge the markets?

Not at all.Capitulation is very difficult to forecast and use as a way to buy or sell stocks. There is no magical price at which capitulation takes place. Certainly during the trading day, stock prices and volumes are monitored and some measurement is used to determine if a capitulation is taking place and will remain so at the end of the day.

But most often, investors and market watchers look back to determine when the markets actually capitulated and see how far stocks have fallen in price for that one day of trading.

When have there been capitulations?

The stock market crash of 1929 that helped lead to the Great Depression, is a capitulation. In fact, it had more than one day of it.

On Oct. 24, 1929-what's known as Black Thursday-share prices on the New York Stock Exchange collapsed. A then-record number of 12.9 million shares was traded.

But more was to follow. Oct. 28, the first "Black Monday," more investors decided to get out of the market, and the slide continued with a record loss in the Dow for the day of 38 points, or 13 percent.

The next day, "Black Tuesday," Oct. 29, 1929, about 16 million shares were traded, and the Dow lost an additional 30 points.

More recently, there was a massive sell off or panic selling of stocks on Oct. 10, 2008, in what can be considered a capitulation. Not only U.S. stocks, but global markets had major declines of 10 percent or more on one day.

Investors flooded exchanges with sell orders, dragging all benchmarks sharply lower. It's believed fears of a global recession and the U.S. housing slump sparked the sell-off.

Tuesday, 14 October 2014

Why Oil Price is Sagging

The respected site oilprice.com did a summary of why oil prices are sagging, but MISSED out one big factor. 

The strengthening USD over the past few weeks. Three or four months back, the turmoil in Iraq was causing some disruption anticipation to oil supply, which have been eased following the "drones strategy with partners". 

The USD has rallied over the past few weeks in anticipation of a uptrend in interest rates there, coupled with better recovery in the US compared to other developed counterparts. However, to me the strength in USD is not that permanent but rather a rebalancing and will not rise by much from hereon.


1. The U.S. Oil Boom
America’s oil boom is well documented. Shale oil production has grown by roughly 4 million barrels per day (mbpd) since 2008. Imports from OPEC have been cut in half and for the first time in 30 years, the U.S. has stopped importing crude from Nigeria.


2. Libya is Back
Because of internal strife, analysts have until recently assumed that Libya’s output would hover around 150,000-250,000 thousand barrels per day. It turns out that Libya has sorted out their disruptions much quicker than anticipated, producing 810,000 barrels per day in September. Libyan officials told the Wall Street Journal last week that they expect to produce a million barrels per day by the end of the month and 1.2 million barrels a day by early next year.

3. OPEC Infighting 
There have been numerous reports about the discord between OPEC members, leading many to believe that OPEC will not be able to reign in production like it has done so in the past. The Saudis and Kuwaitis have reportedly been in an oil price war, repeatedly lowering their prices in order to maintain their market share in Asia. John Kingston, the news director at Platts, believes that the Saudis will not be willing to give up market share like they have done during previous price drops.


4. Negative European Economic Outlook
European Central Bank president Mario Draghi has left investors concerned about the continent’s slow growth. Germany’s exports were down 5.8 percent in August, stoking the fears of anxious investors that the EU’s largest economy had double dipped into recession last quarter. Across the Eurozone, the IMF again lowered its growth forecast to 0.8 percent in 2014 and 1.3 percent in 2015.


5. Tepid Asian Demand 
Beyond slow economic growth and currency depreciation, a number of Asian countries have begun cutting energy subsidies, resulting in higher fuel costs despite a drop in global oil prices. In 2012, Asia’s top spenders on energy subsidies, as a percentage of GDP included: Indonesia 3 percent; Thailand 2.6 percent; Vietnam 2.5 percent, Malaysia 2.3 percent, and India 2.3 percent. India is a primary example. Between 2008-2012, India’s diesel demand grew between 6 percent and 11 percent annually. In January 2013, the country started cutting the subsidies of diesel. Since then, diesel consumption has plateaued.

Could Malaysia Be the Next "Houston" (oil & gas hub)


Helped along by a stable, transparent, pro-business government, Malaysia has been quietly building itself into an oil and gas hub, and the world’s oil and gas companies -- who increasingly see this country as a natural base for their broader Asian operations -- have noticed.

With Singapore now the world’s most expensive city, Jakarta in constant gridlock and Bangkok the center of recurring coup activity, Kuala Lumpur is fast becoming the preferred central location for businesses looking to take advantage of the expected growth in South East Asia.

The South East Asian market holds great importance for oil and gas firms due to its location in the center of the Asian-Pacific; some estimates are that it will account for 70 percent of global oil demand from 2015 to 2020.

The region will also be boosted by the development of both onshore and offshore gas markets driven by growing regional demand and high gas prices in Japan and South Korea, which could see shallow water drilling grow 29 percent between now and 2020.  

In addition, next year there will be an increase in development wells drilled offshore in the region: Thailand will drill some 370, followed by China and India, each of which will drill around 200. The regional total by 2020 will be 1,600 wells -- a growth of more than 30 percent over 2014.

To manage these opportunities effectively, a robust Asian Pacific central hub is considered crucial, and with Malaysia’s strong pedigree in training, the full range of oil and gas skills, operators, engineering firms, oil field service companies, and consultancies are rushing to expand in Kuala Lumpur.

Malaysia Petroleum Resource Corporation (MPRC) is also driving this growth by recommending appropriate policies relating to the oil and gas sector as it reviews existing business regulations and tax incentives. With 4,446 international and domestic companies registered with the state oil and gas company PETRONAS  (Petroliam Nasional Berhad) that already contribute 20 percent to Malaysia’s GDP, this has the potential to be huge.

EarthStream predicts Malaysia could be the hottest oil and gas job market in 2015, and over time, it could well become the “Houston of Asia,” with career opportunities for expats and locals alike.

The real winners in all of this will be the returning Malaysians, whose skills are in extreme demand. Already, companies are putting employment packages together to attract local workers back from their tax-free assignments in the Middle East.

By Kevin Gibson of Earthstream

Sunday, 28 September 2014

Realignment in Global Currencies Caused Global Equities to Pause

The worst week for global equities in almost two months finished on a positive note as optimism in the economy’s strength helped counter a procession of concerns from geopolitics to valuations and interest rates.

The Standard & Poor’s 500 Index lost 1.4 percent for the week, paring declines on the final day with a 0.9 percent rally. The MSCI All-Country World Index dropped 2 percent for the five days, the most since Aug. 1. The Russell 2000 Index of smaller companies decreased 2.4 percent. The MSCI Emerging Markets Index tumbled 2.8 percent, heading toward its worst month since January. 

We have to remember that most equity markets are near or at their all time highs. What is different is that I DO NOT see any of these so called all time high markets experiencing crowd madness, euphoria driven rallies, blinkered decision making ... every single market, even at or near their all time highs have been relatively subdued.

That is the crux of the current rally. Is it a liquidity driven rally? Well any bull run has to be driven by cheap money. The only thing is that not many people want to gear up or take advantage of low interest rates to leverage up to participate in the markets. However, many corporations and funds have been more than willing to gear up. Many institutional funds are willing to look for better returns. Hence much of the INDEXED STOCKS highs are due to this, an accumulation by institutional funds ... hence you do not feel the euphoria so much. 


The bulk of the activity has been in small caps, look at any market for the past 2 years. There certainly has been a flattening of many major property markets, not correction, but flattening out. We can surmise that a substantial amount of that liquidity may have trickled into equity markets, esp the smaller caps play.

However most equity markets traded sideways for the past week or so, MAINLY as there is an adjustment or realignment process going on in the global currencies arena. It appears there are some main conclusions reached by the majority:
a) Fed will raise interest rates very soon
b) resource led currencies will not get any help from China demand
c) Japan's reflationary tactics gaining traction
d) US recovery more solid and is diverging from EU

Equities fell early in the week as stronger economic data fueled concern the Federal Reserve may raise interest rates sooner than anticipated. The issue took a back seat on the final day as the S&P 500 rebounded from the biggest one-day decline since July on a report showing U.S. gross domestic product expanded in the second quarter at the fastest rate since 2011.

Interest Rates

Investors are analyzing reports to assess whether growth is strong enough to withstand higher rates. The S&P 500 reached a record on Sept. 18 after the Fed maintained a commitment to keep interest rates near zero for a considerable time after completing asset purchases. The Fed also said that the timing could move forward if data continues to exceed expectations.

Interest-rate concerns boosted the dollar, sending the greenback to a four-year high and its sixth straight week of gains. Its rally sent the MSCI Emerging Markets Index to a third week of losses. The gauge has tumbled 5.8 percent in September.


Reports for the week showed the U.S. economy rose at a 4.6 percent annualized rate in the second quarter, up from an August estimate of 4.2 percent. New-home sales surged to the highest level in more than six years, and American factories received more orders for machinery as an improving economy gave companies the confidence to expand.

The USD was set for the biggest monthly gain in more than two years as reports showing a stronger U.S. economy added to bets the Federal Reserve will boost interest rates sooner than its peers in Europe and Japan.


The greenback rose to the strongest level in 22 months versus the euro before the European Central Bank meets Oct. 2 to discuss the region’s slumping economy. The yen approached the weakest in six years amid slowing inflation and mixed signals on the speed of pension-fund changes. Emerging-market currencies headed lower, while the Bloomberg Dollar Spot Index reached the highest since 2010.
Brazil’s real is the biggest loser among the dollar’s 31 major counterparts this month as investors weighed voter support for President Dilma Rousseff in next month’s election amid a recession and inflation. The real has dropped 7.6 percent to 2.4201 per dollar, and it touched 2.4433 yesterday, the weakest since Jan. 29.

New Zealand’s dollar has tumbled 5.9 percent as central-bank Governor Graeme Wheeler called its level “unjustified,” one of policy makers’ criteria for intervention. The kiwi, nicknamed for the image of the flightless bird on the NZ$1 coin, reached 78.60 U.S. cents yesterday, the lowest level since September 2013.

The kiwi led currencies of commodity-exporting nations including the Australian dollar lower amid doubts about the sustainability of economic growth in China, the world’s second-biggest economy.

The yen fell as Health Minister Yasuhisa Shiozaki, whose ministry oversees the Government Pension Investment Fund, said pension reform would go ahead.  Shiozaki said there’s no plan to postpone a law change that would improve governance of the Government Pension Investment Fund. A review of asset allocation may see it increase riskier investments, including foreign stocks and debt.


The Bank of Japan, which meets Oct. 7, is trying to boost inflation to 2 percent by pumping 60 trillion yen ($550 billion) to 70 trillion yen a year into the economy. BOJ Governor Haruhiko Kuroda said Sept. 18 in Tokyo he won’t hesitate to adjust monetary policy if needed.

The Fed is considering when to raise interest rates for the first time since 2006. There’s a 78 percent chance the benchmark rate target will go up by September 2015, according to fed-fund futures data compiled by Bloomberg.

So, what will happen? It appears that players used to very scared of any raising of rates by the Fed and were somehow too attached and reliant on QE measures to sustain interest in equities. However, I see a pronounced deviation from that view now. The increase in rates by Fed will actually be a lifting of a stumbling block as unemployment data looks too good to ignore. If the real economy is strengthening, one or even two rate hikes won't kill the market. Maybe the third strike.

I expect a vibrant equity market globally for the last quarter of 2014.

Thursday, 25 September 2014

So What's the Right PE?

You tell me! (Let's not talk about other valuation methods - strictly PE)

I remember when I started investing, people (or some books) used to tell - anything that is above 8x PE is considered expensive. That practice is still within some Malaysian VCs, investors where they would even look at prospective PE of 3x - 5x. Is this archaic measurement realistic?

Times change, appetite changes as well. However, if one is to look at the global interest rate trend, starting with the US Fed Funds rate - where it has come down from a high of almost 20% in 1980 during the Volcker period to now post-2008 subprime crisis where the Feds are keeping rates at almost zero, should it signify something?

Similarly, Japan has even kept rates at zero for much longer period, basically for the entire 21st century thus far (see below).

In Malaysia, I am pulling out the time (fixed) deposit rate where it has dropped from above 8% to hovering around 3.0% to 3.5% for more than 10 years now, where does one expect to put their money? - in FD still? Would one's risk appetite be higher investing into stocks, properties, even commodities etc? Surely.

If one has a higher risk appetite, due to the low deposit rates together with low financing rates from banks - would the accepted average PE generally be higher? Again surely.

If one is to look at the general trend from US to EU to Japan as well as in a period where funds are able to move freely, would you think that these funds would look at opportunities all over the world? It is much easier for some of the funds to get financed from a low interest rate country and invests their money in any investments that would get them anything that would provide between 8% to 10%, sometimes lesser - assuming currencies exchange does not change much.

So, what's the right PE? Anything that provides me higher than the 3.4% what banks is giving me, or for some bigger funds - anything higher than high quality bonds, with a little bit of buffer.

With that wouldn't you think that any business that has a good consistent growth, a PE of somewhere between 15x to 20x, be even digestible?

Or someone has a crystal ball and can see that interest rates are moving upward fast in the near future?

Saturday, 20 September 2014

What Happen to Comodities

I am not so much of a commodity person. For an investor in commodity, I have always believed that the investor has to have a much better macro picture i.e. consumption of steel in the construction industry. Another example, edible oil market i.e. comparison between sunflower vs soy vs palm oil. What are their prices per metric ton. Which are consumed more etc? These are things that I am not able to understand well.

Look at the prices of major commodities here especially over their 52 weeks price range.

Similarly, for platinum, silver there must be some use for those i.e supply and demand - or real industrial use. Over the last decade commodities were doing well.

However, these have not been so for the last one year or even more. Read the news I picked up from BusinessInsider below.
-----------------------------------

Silver is getting crushed.
On Friday, Silver fell more than 3% to less than $18 an ounce, its lowest level in more than four years.


View gallery
.
silver
FinViz
The price of gold also fell about 0.8% and touched its lowest level since January. Gold has been weak recently and is approaching a four-year low.


View gallery
.
gold
FinViz
Platinum also fell to a nine-month low.
-----------------------------------
What actually happened. These commodities are no longer used for its real purpose i.e. industrial, consumption etc. They have been pretty much speculated. Or could it be China's slowed consumption? I am pretty sure we are not worse off today as compared to four years ago globally. Although it made some sense that gold were sought after during bad times or during period of uncertainties, but what about platinum, copper or silver? Aren't they sought after for industrial purposes?
For that matter I am not really sure whether palm oil has found its low.
For a while, investors have been very speculatively positive over commodities and they seemed to have lost their fangs recently.